Transport Sector Emissions
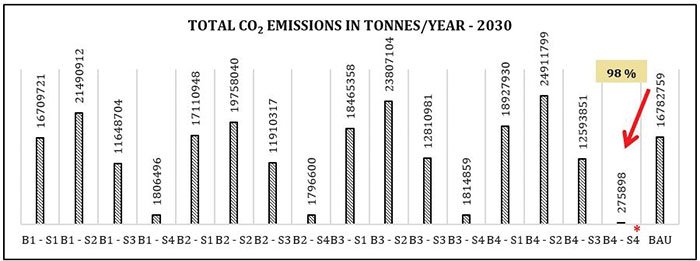
It is seen that there is a lot of reduction in total emissions and per capita emissions in sustainable transport scenarios compared with the BaU scenario.
The study says that the B4-S4 scenario has the potential to reduce CO2 emissions by 98% compared with the BaU scenario. The table shows the impact the B4-S4 scenario has on reducing emissions from Bengaluru transportation making the city more livable.
Impact of The Metro Transport System
The main idea of this proposed project is to ease the Bangalore traffic by connecting the suburbs to the Central Business District and one another to enable seamless travel between any of the entry/ exit points of the corridor. This study highlighted that the proposed elevated road corridor will only result in increased traffic congestion, VKTs, and vehicular emissions. On the contrary, it was suggested that the metro corridor will be a better option. The technical analysis was carried out with the assumption that the elevated corridor will be opened for traffic in 2020. The simulation was implemented for 2017, 2020 and 2030 considering the following scenarios:
• Business as Usual Scenario (BAU) – Scenario without flyover construction.
• Scenario 1 (S1) – Scenario where the flyover is constructed.
• Scenario 2 (S2) – Scenario where the metro is constructed instead of flyover along the same proposed corridor.
The study emphasises that the construction of flyovers will only attract a greater number of cars and two-wheelers which will eventually lead to traffic congestion. The mode shares of cars and two-wheelers increased by 60% and 5% in 2020, as well as by 23% and 9% in 2030 due to the addition of new road infrastructure. On the other hand, the mode shares of public transport account for about 56.1% and 61.3% in the metro corridor scenario. The analysis stresses that the addition of the road network will result in increased VKT of about 2.7% in 2020 and 4% in 2030.
The road infrastructure will only attract more private vehicles as every individual use the facility to reach their destination without any hassle. Since most of the private vehicles are attracted to the flyover, the congestion on the neighbouring roads is reduced thus leading to jamming conditions on the elevated corridor.
The construction of flyovers has increased the VKT because of the commuters trying to reach their destination from every direction thereby increasing the emissions (CO, HC, NOx, CO2, PM). On the other hand, the construction of the Metro rail has led to a shift towards reducing VKT from all private modes of transport thereby reducing emissions. The total per person emissions for CO2 and PM from all the modes for the years 2020 and 2030 are much lower in S2 scenario compared to S1. While the per capita CO2 emissions reduce by 30% and 27% for the years 2020 and 2030 respectively. Resulted in a reduction of 20% and 25% for PM for 2020 and 2030, respectively.