Today, almost every Indian megacity is experiencing traffic congestion and its subsequent problems. Ever increasing transportation needs of the exploding urban population cannot be met perpetually as the available land mass does not change. Thus, the need of the hour is to reshape the transportation networks and infrastructure available in Indian cities. Introduction of Intelligent Transportation Networks offer a viable solution and can help urban planners reduce traffic congestion in cities to a large extent.
Integrating Technology into Transportation System
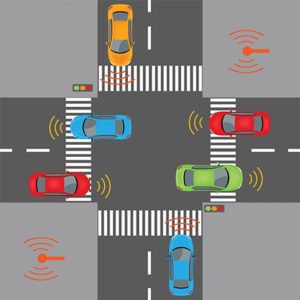
 Technological integration in transportation system helps in predicting and analysing the traffic to avoid congestion and gridlocks on the roads. Traffic sensors help detect whether cars have entered turn lanes, arrived or are stacked at intersections. There are numerous technologies which are used in traffic sensor devices such as infrared, radar, lasers, rubber hoses, video detection, piezoelectric and inductive loops. Inductive loops technique is the most commonly used technique owing to its simple structure and its advantage that it does not get affected by weather conditions.
The global traffic sensor market is segmented based on type, application, and region. Based on type, the market is subdivided into infrared sensors, inductive loops, LiDAR sensors, piezoelectric sensors, magnetic sensors, radar sensors, thermal sensors, acoustic sensors, thermal sensors, and image sensors.
Roadway Sensors
An effective traffic surveillance and monitoring system is a pre-requisite for any intelligent traffic control system to keep track of prevailing conditions across the network. A wide range of different sensors are installed in, on and above the roadway for this purpose and to obtain the necessary geographical and critical time coverage. They include inductive loops, non-intrusive traffic detection devices, video cameras and video image processing. Each technology has its own advantages and shortcomings – so the choice of sensor type for any ITS application will depend on what performs well in the prevailing environmental conditions, and its cost.
The Sensor is a key element of any smart system and a course of action is taken based on its location. The control system gathers the data from a group of sensors and uses different variables to distinguish its location and modifies its actions consequently.
Sensing Evolution
Smart cities are looking forward to real-time monitoring of traffic at major strategic arterial/urban road network across the city, for getting data on livetraffic, average speed, gap, headway, occupancy, counting and classification. The data will not only provide real time information of traffic but will also help in planning resource allocation based on traffic status and forecasts. The data should be collected, stored and should be available to traffic police and authorities/CCR to compare with present data and help in forecasting of traffic. The entry and exit of some stretches roads/zones will be done initially to evaluate flow of traffic and its effect on traffic conditions at various times of the day/weeks etc.
 Aabmatica Technologies Pvt Ltd have developed this solution using different 3D/4D, HD/UHD smartmicro sensors. Forward firing 3D object tracking with UHD resolution along with laser scan technology are used to get the best results in all weather conditions. “These sensors are not image dependent, do not require cleaning activities and work with minimum bandwidths available”, said Arvind Tewari, Director at Aabmatica Technologies.
The analysis and processing of traffic data software provides customizable reports both in tabular and in graphical form, based on the variables of interest as needed by the user department. The report generation can be done by selecting various parameters through a simple and intuitive graphical interface allowing to achieve maximum flexibility, or by selecting the standard reports with variables previously set.
The standard reports include:
 • Average daily traffic weekday / holiday / seasonal
• Peak hour traffic
• Thirtieth rush hour
• Trend of variation of daily traffic
• In addition to the reports mentioned above, many other standard reports will be implemented for evaluating the traffic (eg traffic per month, annual traffic, hours of slow traffic per day / month / season, hours of stopped traffic (queue) daily / monthly /seasonal …) accordingly to the client’s needs.
The main functionalities which are available at traffic suit at CCR are:
• GIS: interactive map/synoptic allowing easy and quick monitor of the equipment located in each position
• Visualization of summary and detailed information from the traffic monitoring sub-systems
• Visualization of alerts and anomalies reported by monitoring sub-systems
• Visualization of “real time” data from the traffic monitoring system by selecting an item on the map
• Access to control and configuration interfaces of each traffic count station
• Access to the diagnostics of substations
• Access to historical traffic data and statistics
• Various data comparison possibilities for hourly, daily or weekly to evaluate traffic data
• Complete back up of data for at least next 10 years
• Graphical interpretation of data
• Optional (time to travel & other information’s with possibility of integration with VMS)
 TrafficInfraTech Magazine Linking People Places & Progress


