The National Data Warehouse in the Netherlands has teamed up with the DiTTlab research group at the Delft University of Technology to relate different types of (traffic) data together. Combining these data types (real-time traffic-, incident-, roadworks-, event- and weather data), each containing different characteristics, geographical referencing and timeframes, will lead the team to novel insights and analysis possibilities of the traffic state, further explored in a multi-year project proposal that will allow the multi-scale analysis of traffic with all relevant data, from road section level to the national scale. This will lead to innovative applications to predict the traffic state that can be used in all future ITS developments. The first steps have produced promising results: an application has been realized, making it possible to relate traffic data with related road works, incident and the weather conditions. This gives novel insights and analysis possibilities for traffic engineers and policy makers. The following is a presentation given by Edoardo Felici, National Data Warehouse for Traffic Information (NDW) and co-authored by Hans van Lint, Delft University of Technology at ITS World Congress, Melbourne in October 2016.

Edoardo Felici
The initial procurement of traffic data by NDW in 2009 provided speed measurements, travel times and vehicle counts with vehicle categorization measured on approximately 24.000 locations throughout the country on the main road network and a number of provincial roads. The network of measurements has expanded over the years to include higher coverage on provincial roads and main urban roads, delivering data on 7.100 kilometers of road as of November 2015. Besides speed measurements, travel times and vehicle counts, information on the status of infrastructure is also delivered through NDW. Data on the opening of bridges, roadworks, rush-hour lanes and incidents is gathered within NDW and delivered to stakeholders on occurrence.

Hans van Lint
In 2015 NDW has teamed up with the Delft University of Technology to develop this within the Delft integrated Travel and Transport Laboratory (DiTTlab). Within DiTTlab, a university research team collaborates with companies and governments to develop an open source, multi-scale and integrated environment for the assimilation of traffic data from all possible sources. For NDW, this has resulted in the creation of the NDW Traffic Observatory, wherein the big data foundations for the full exploitation of NDW data can be laid down.
Relating real-time traffic data to events and weather conditions
Relating different data types
During 2015 the team at DiTTlab worked on the first step: technically relating the data types to each other. This has resulted in the development of a webtool wherein a geographical route selection can be made, and the resulting traffic data including the related events (related road works, events and incidents) is generated. A time-space diagram is then available to analyse the traffic situation on the chosen route and day, including information about weather conditions. An export tool allows the user to download all the relevant data.
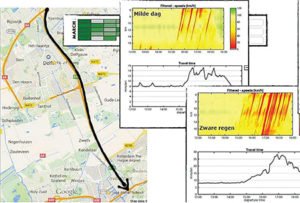 Figure 1 shows the traffic conditions in a time-space diagram on a day with ‘mild’ weather (top), compared to a day with heavy rainfall (bottom). The timespace diagram shows the time of day on the horizontal axis and the distance along a road on the vertical axis. This analysis can now be done on-the-fly through the DiTTlab application. This is achieved through the creation of a cross-section of the selected route. All relevant events along this cross-section, including the weather conditions on the chosen date and time period, are then extracted from the NDW-data an dvisualized as input for the analysis. Thishas resulted in a database with 12.447 cross sections, created from 66.589 measuring points (which amount to 5.1M if changes on the network over time are considered). On these crosssections, 2.382.489.886 lane and vehicle class records with measurement data can be dynamically related and visualized in the DiTTlab application.
Automatically recognizing congestion patterns
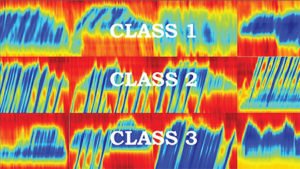 Time-space diagrams show a variety of possible congestion patterns that can relate to specific traffic situations. Incidents, shockwave traffic jams or roadworks each result in a specific and recognizable pattern in a time-space diagram.
The next step in the NDW-project at DiTTlab is to create an application that is able to recognize these patterns on the basis of a colormap. Color keypoints are
automatically extracted from the timespace diagrams to create a description of specific features. This allows to summarize traffic patterns into a histogram of vectorised features using the SURF and K-means algorithms.
The feature vectors created from the different classes of traffic patterns (see figure 4) can then be processed in an support vector machine-classifier (SVM) to train a model in automatically recognizing these patterns, thus creating a self-learning application.
 TrafficInfraTech Magazine Linking People Places & Progress
