
Page 65 - Trafficinfratech Magazine Aug - Sept
P. 65
TRAFFIC MANAGEMENT
transport account for about 2020 and 2030 are much lower private vehicle trips. Therefore,
56.1% and 61.3% in the metro in S2 scenario compared to S1. policies to discourage the use
corridor scenario. The analysis While the per capita CO emissions of private vehicles, providing
2
stresses that the addition of reduce by 30% and 27% for the infrastructure and improving
the road network will result in years 2020 and 2030 respectively. serviceability of the public
increased VKT of about 2.7% in Resulted in a reduction of 20% transit network are identified
2020 and 4% in 2030. and 25% for PM for 2020 and to be the sustainable solution
The road infrastructure will 2030, respectively. for mitigating transportation
only attract more private vehicles Summary problems, thereby enhancing the
as every individual use the facility livability of the city.
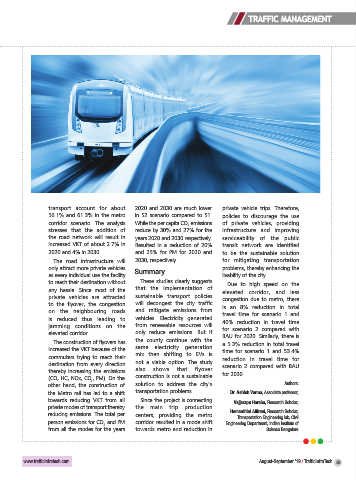
to reach their destination without These studies clearly suggests Due to high speed on the
any hassle. Since most of the that the implementation of elevated corridor, and less
private vehicles are attracted sustainable transport policies congestion due to metro, there
to the flyover, the congestion will decongest the city traffic is an 8% reduction in total
on the neighbouring roads and mitigate emissions from travel time for scenario 1 and
is reduced thus leading to vehicles. Electricity generated 40% reduction in travel time
jamming conditions on the from renewable resources will for scenario 2 compared with
elevated corridor. only reduce emissions. But if BAU for 2020. Similarly, there is
The construction of flyovers has the county continue with the a 5.3% reduction in total travel
increased the VKT because of the same electricity generation time for scenario 1 and 53.4%
commuters trying to reach their mix then shifting to EVs is reduction in travel time for
destination from every direction not a viable option. The study scenario 2 compared with BAU
thereby increasing the emissions also shows that flyover for 2030.
(CO, HC, NOx, CO , PM). On the construction is not a sustainable
2
other hand, the construction of solution to address the city’s Authors:
the Metro rail has led to a shift transportation problems. Dr. Ashish Verma, Associate professor,
towards reducing VKT from all Since the project is connecting Vajjarapu Harsha, Research Scholar,
private modes of transport thereby the main trip production
reducing emissions. The total per centers, providing the metro Hemanthini Allirani, Research Scholar,
Transportation Engineering lab, Civil
person emissions for CO and PM corridor resulted in a mode shift Engineering Department, Indian Institute of
2
from all the modes for the years towards metro and reduction in Science Bangalore
www.trafficinfratech-com-500653.hostingersite.com August-September ’19 / TrafficInfraTech 65